FC Barcelona: The System, Who Fits It & The Pathway
One club read through Promesse: how Barça play, who fits Flick's roles, how La Masia turns teenagers into careers
- Context
- Personal project · a Promesse deep dive
- Role
- Solo: analysis, models and the page
- Team
- Solo
- Period
- 2026
- Galleries
- Tactical Analysis, Player & Match Modelling
The problem
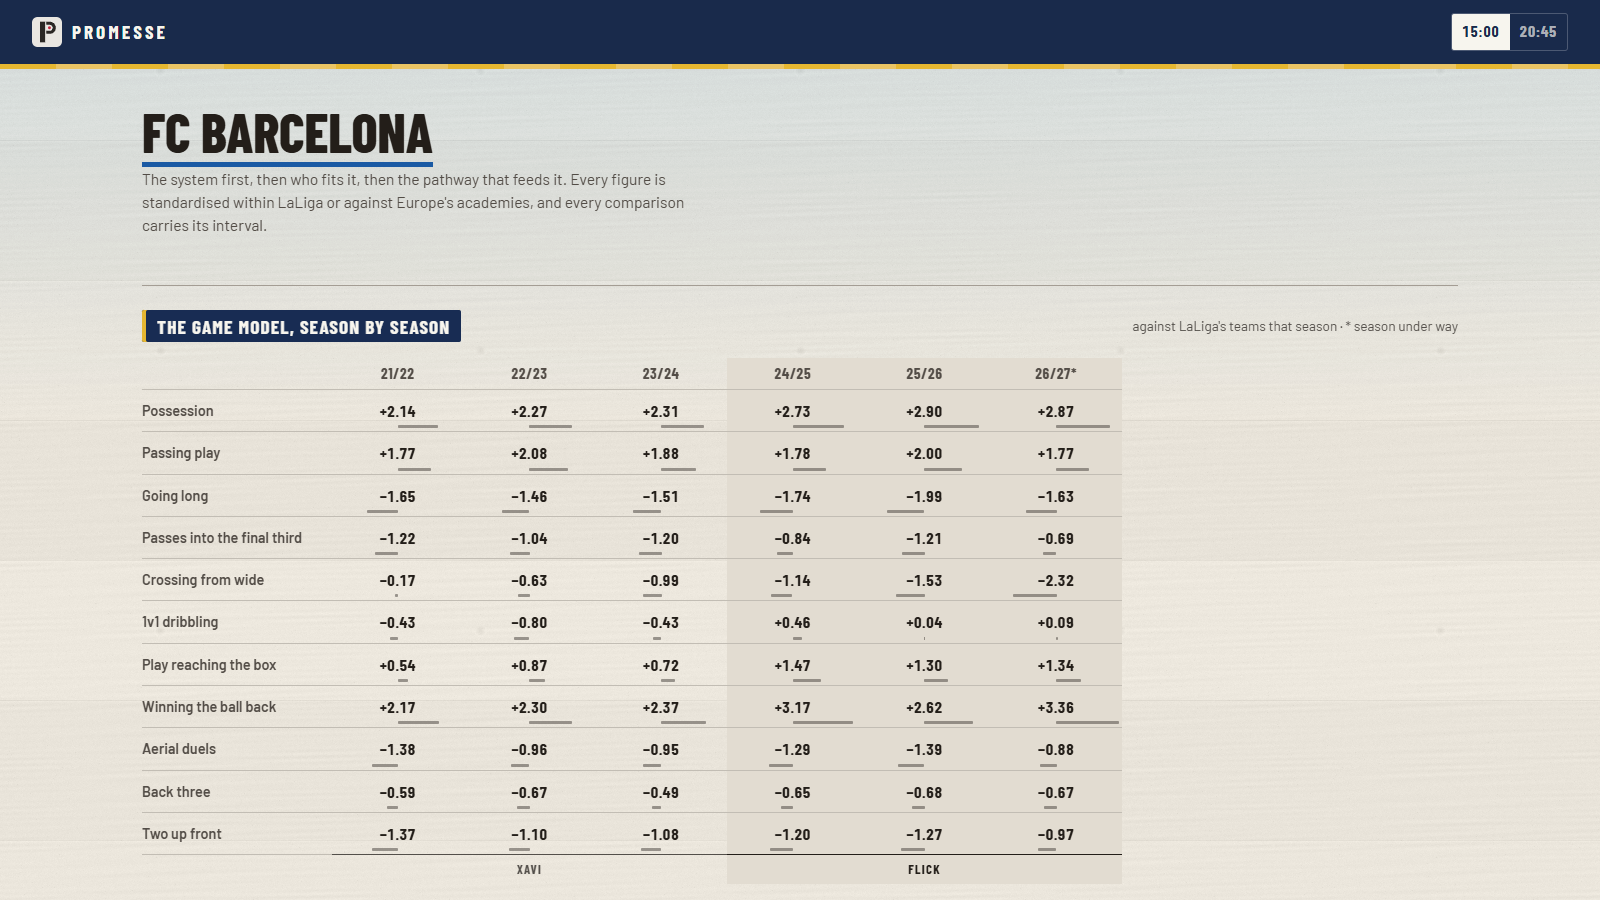
A coach's style is easy to describe and hard to measure. I wanted Barça's game model measured season by season against the league's other teams, what changed when Flick replaced Xavi, and which young players would fit each role, with every claim carrying its interval and the dimensions that failed their test left out.
What I built
- Eleven style dimensions (possession, passing play, going long, progression, width, dribbling, play reaching the box, winning the ball back, aerial duels, a back three, two up front), each standardised against LaLiga's teams that season. A dimension is used only if a team's odd and even matches rank the league the same way (Spearman rank correlation, bar 0.6, set before the test): four of fifteen failed and are not shown.
- What Flick changed, match by match, with bootstrap intervals; his shape at Bayern and at Barça, and the teams that play most like his Barça.
- For each role in his team, the players 23 or younger whose game, moved into Barça's game model, sits closest to what his regulars do; the same lens on La Masia's U19s.
- How La Masia turns U19 players into careers, against 17 European academies, with 95 % intervals.
- The engine's single-player calls on the page carry their ranges and are labelled beta.
The outcome
A page you can open and read: the system, who fits it, the pathway, and how firm each part is. At Barça against Xavi, Flick's team scored 0.65 more goals a game (1.94 to 2.59), with a 95 % interval from 0.23 to 1.07 that excludes zero.
What would come next
- The same reading for a third club, once the data holds up its own reliability tests there.
Stack
What it proves
The page publishes analysis only. The match data behind it is privately collected data and open datasets; no rows are published.